Frequently Asked Questions
- What are the ways the server can be installed?
- What are the ports used by the server?
- What are the options for connecting detectors to the server?
- How do I customize the charts display?
- How do you download the chart data?
What are the ways the server can be installed?
There are currently 4 available options to install the server. More options may become available in the future.
- An H3D supplied pre-built laptop running the Ubuntu 20.04 Desktop operating system.
- Install the server on customer supplied cloud infrastructure based on RedHat Enterprise/CentOS 7 or 8.
- Note: The docker.io install package is required.
- Install the server on customer supplied cloud infrastructure based on Ubuntu 18.04 or 20.04.
- Note: The docker.io install package is required.
- A Windows 10 computer with VirtualBox software installed.
What are the ports used by the server?
The server does not require outside internet during normal operation, and should not initiate any outgoing connections. However updating the operating system requires outside internet, and the initial install of the docker.io package requires outside internet.
The server listens for incoming connections on these ports:
22
- An SSH client program will connect to this port so that maintenance can be performed on the server.
8080
- Web browsers connect to this port using HTTP to get the server's HTML web pages.
- Note: If an SSL certificate is available, it is possible to configure the server for HTTPS connections.
22423
- Detectors connect to this port when they have data to upload to the server. The server will send acknowledgement messages back to the detectors.
- The server will never initiate a connection with a detector.
22425
- Web browsers connect to this port to send commands to, and get information from the server.
What are the options for connecting detectors to the server?
In order to use the Polaris S web server features, you must be able to connect the detectors to the server. Here are the available connection options:
- Wired Ethernet
- The detectors can be connected using a standard wired Ethernet network connection.
- WIFI network
- Detectors equipped with WIFI can connect to a WIFI network.
- 900MHz radio
- H3D provides an alternative wireless connection solution based on the XBee radio.
- A USB port on the server is required in order to plug in the XBee radio receiver.
- There are no ports or IP addresses associated with the XBee radio connection.
- Sneaker-net/USB
- USB drives can be periodically removed from detectors and the data manually uploaded to the server using a Windows computer.
How do I customize the charts display?
Chart display can be customized using the Customize button.
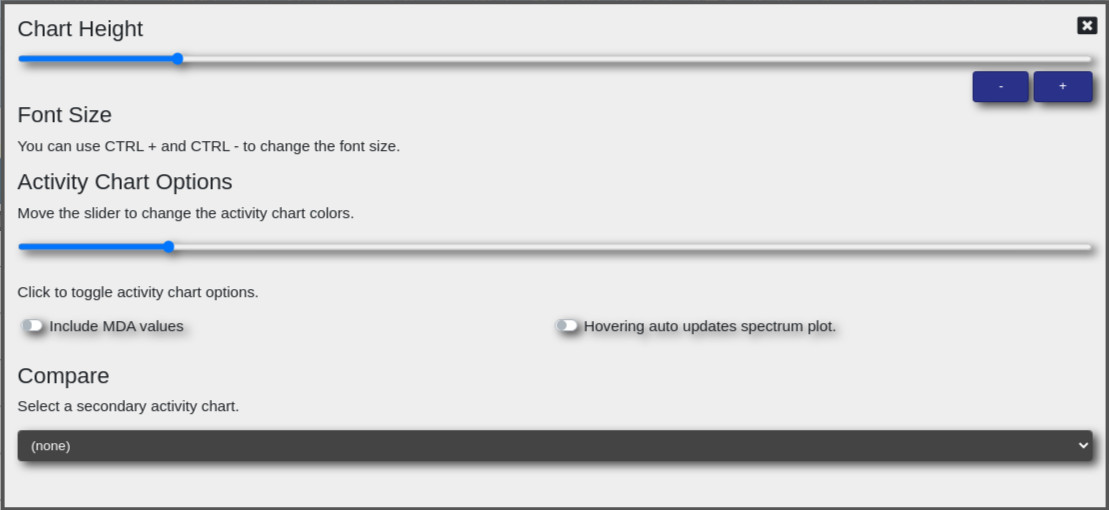
Chart Height
- The chart height slider bar is used in conjunction with the browser sizing buttons (usually Ctrl-+ and Ctrl--) in order for you to make a good balance between the font used by the chart and the overall size of the chart for your screen.
Include MDA values
- When an isotope's presence becomes too faint for positive identification, the MDA value may be substituted on the chart. Note: The MDA option has been moved to the chart setup page.
Hovering auto updates spectrum plot
- While the mouse is hovering over the activity chart, auto update the spectrum plot.
How do you download the chart data?
The data in the charts can be downloaded into a text file that is formatted for import into spreadsheet software.
Download1
- The Download1 button downloads isotope activity detection data found in the upper chart.
Download2
- The Download2 button downloads spectrum counts found in the lower chart.
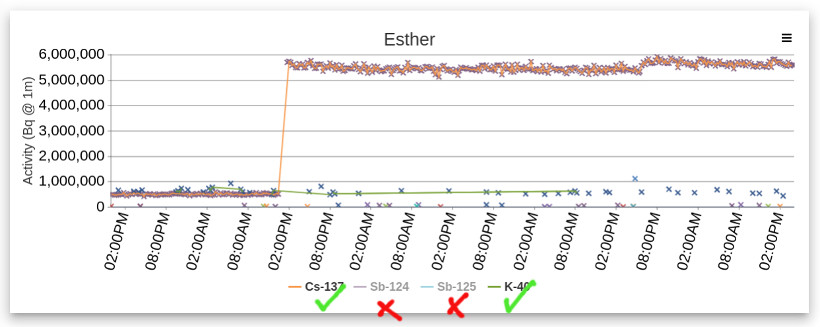
You can choose which isotopes you want to include when exporting to a spreadsheet. By clicking on the chart legend you can hide data for isotopes that you want to leave out of your spreadsheet. In the image below you can see that only Cs-137 and K-40 will be included when clicking Download1. The isotopes Sb-124 and Sb-125 will not be included.